You must already be aware of ‘carbon footprint.’ And like the rest of us, you are probably eager to reduce it.
Step one: Swap your existing clothes with ones whose greenhouse gas emissions are low. GHG emissions are the basis of the assessment of carbon footprint.
Why?
- The fashion industry emits the same amount of greenhouse gasses per year as the entire economies of France, Germany and the UK. This is equivalent to nearly 10% of all humanity’s carbon emissions.
- The fashion industry’s greenhouse gas emissions are expected to increase by more than 50% by 2030.
We have to fight these numbers together. You might think GHG emissions of cotton are low and you only use organic cotton so this doesn’t concern you. But there are much better alternatives out there.
Start small. Start with becoming an informed customer.
Why did I write this article?
This article is meant to tell you that there are alternatives. You don’t have to shop at Zara and H&M.
I have broken down the greenhouse gas emissions stage by stage for every textile and found that hemp is the best textile you can purchase. Regarding GHG, hemp wins the race even leaving organic cotton behind.
There are six different types of gasses present in the atmosphere giving a significant impact on the greenhouse effect:
• Carbon dioxide (CO2)
• Methane (CH4)
• Nitrous oxide (N2O)
• Hydrofluorocarbons (HFCs)
• Perfluorocarbons (PFCs)
• Sulfur hexafluoride (SF6)
Because of the data available, I have mainly focused on CO2 emissions.
CO2 emissions happen during different stages of production – preparation, planting, field operations (weed control, mechanical irrigation, pest control, and fertilisers), harvesting, and yields.
And when you are calculating the CO2 emissions of the shirt that you are wearing, you also have to factor in the mode of transportation that was used to deliver the shirt to you.
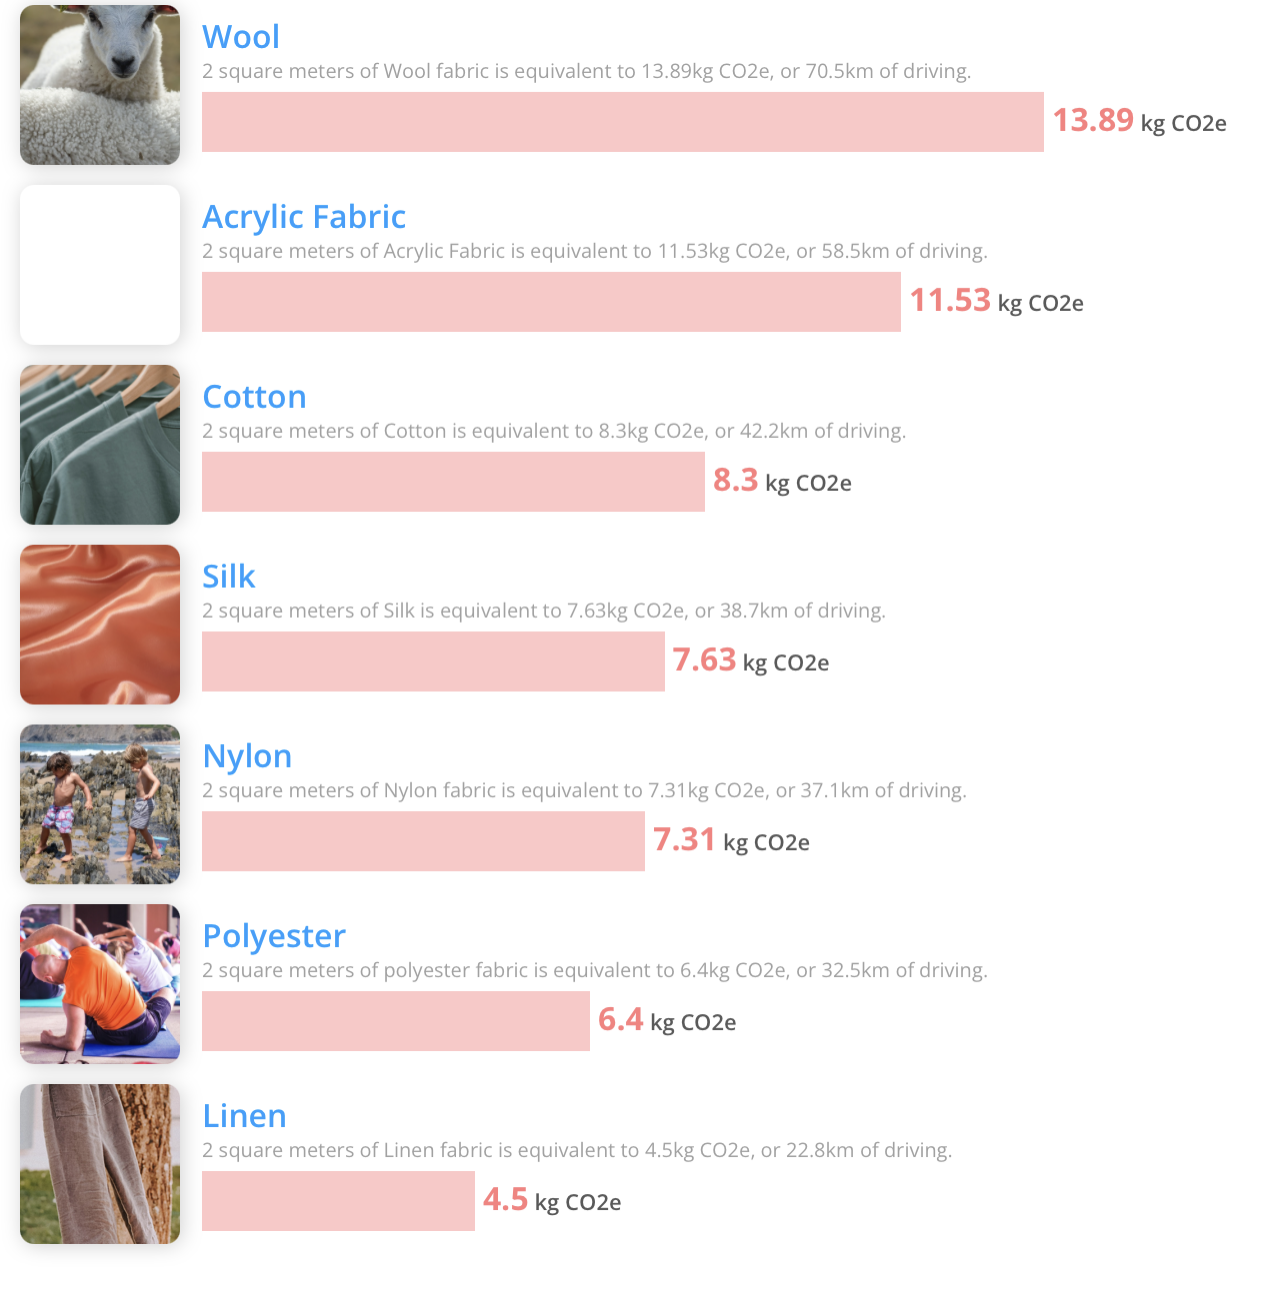
Here are the CO2 emissions of the most commonly used fabrics.
GHG emissions of cotton in each phase of production
Let’s start with one of the most common textiles, cotton. Cotton is mixed into almost every garment that we use.
As per CO2 everything, 2 square meters of Cotton is equivalent to 8.3kg CO2e
Here is the data for the spun fibre from studies carried out by the Stockholm Environment Institute on behalf of the BioRegional Development Group.
A kilogram of CO2 Emissions per Ton of Spun Fiber
| Crop Cultivation | Fiber Production | Total | |
| Cotton, conventional (USA) | 4.20 | 1.70 | 5.90 |
| Cotton, organic (USA) | 0.90 | 1.45 | 2.35 |
| Cotton, organic (India) | 2.00 | 1.80 | 3.80 |
Cotton farming system
This stage includes GHG emissions of cotton from transportation of farm inputs (farm machinery, agrochemicals, and fertilizers), production, packing and storage, production, extraction, and use of electricity for irrigation, and N2O emissions from soils due to N-fertilizer usage.
This table represents data from one irrigated system and other dryland farming systems in Queensland, Australia.
| Dryland double skip | 1376 kg CO2e/ha |
| Dryland solid plant | 1376 kg CO2e/ha |
| Irrigated cotton farming | 4841kg CO2e/ha |
Textile finishing
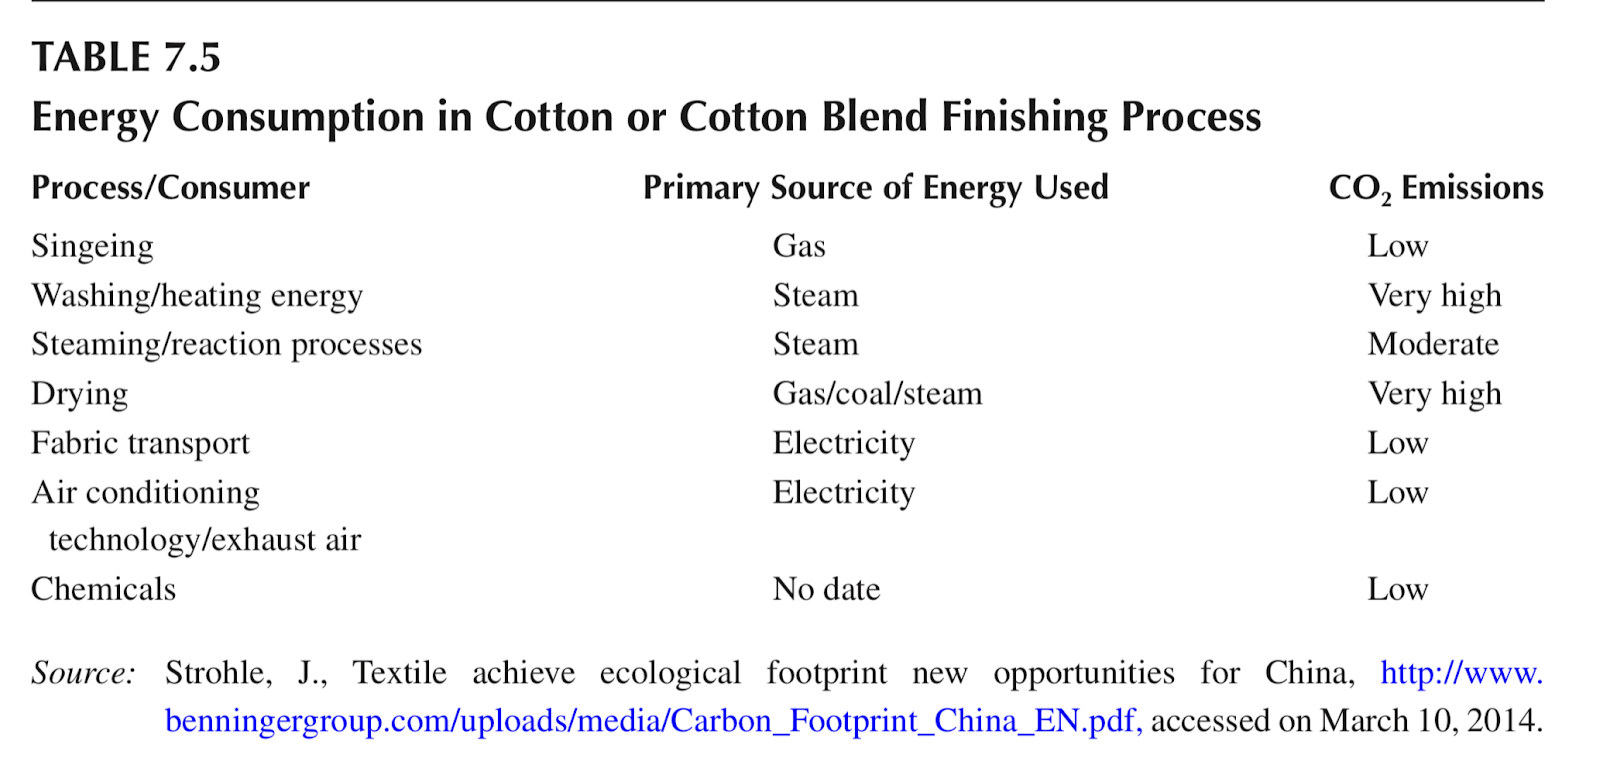
CO2 emissions are caused directly by the energy consumers and indirectly by the consumables such as lubricants and chemicals.
- 40% comes from washing and steaming.
- 50% comes from drying
- 10% from the use of chemicals.
- In knitwear finish-ing using the exhaust process, 60%, is caused by heating of water.
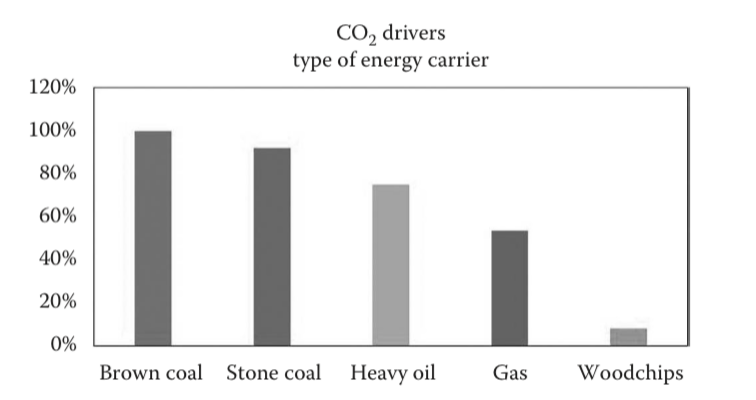
This table provides details of energy consumption in the cotton or cotton blend finishing process. Notice how the source of energy affects CO2 emissions.
The Garment phase
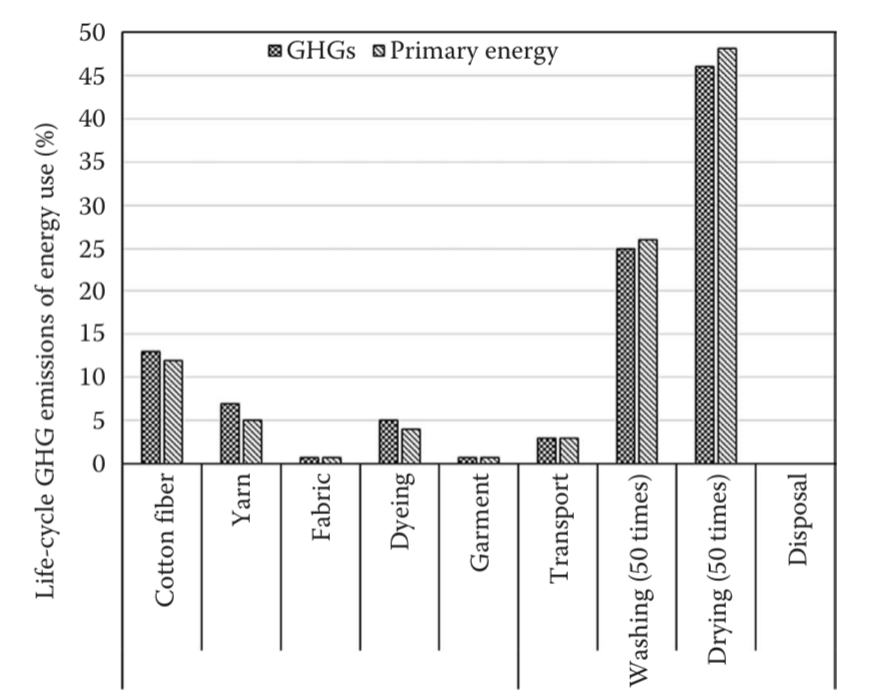
The highest CO2 emissions happen when the textile becomes your T-shirt, pants etc.
Here is the garment life cycle GHG emissions of your cotton T-shirt. This graph shows how your T-shirt emits GHGs throughout its life from becoming fibre till its disposal.
Here are other significant figures.
- Organic agriculture emits 43% less GHG than conventional agriculture. So, just by switching to organic textiles, you can reduce the GHG emission of your clothes by almost 43%.
- When checking the CO2 emissions of your garments don’t just fall for the numbers that account for the fibre production, manufacturing of goods, trade, and transport. That only accounts for 50% of CO2 emissions. The remaining 50% are caused by daily usage.
- Where your clothes were manufactured matters. Depending on the primary energy source of the country, the CO2 emissions can be much greater. For example, textiles made in China have a carbon footprint that is around 40% greater than in Turkey, Europe, or South America, simply on the basis of the selected energy source.
Now that we have understood the GHG emissions of cotton in detail. Let’s look at other fabrics in comparison. I use cotton as a base because cotton, especially organic cotton, is understood as less evil as compared to other textiles. The aim of this article is to tell you that you can do better than cotton which is allegedly a safe textile.
| Fiber Type | Energy Consumption kW h/kg Fiber | CO2 Emissions in kg/kg Fiber |
| Nylon | 69 | 37 |
| Acrylic | 49 | 26 |
| Polyester | 35 | 19 |
| Polypropylene | 32 | 17 |
| Viscose | 28 | 15 |
| Cotton | 15 | 8 |
| Wool | 13 | 7 |
| Hemp | 5 | 3 |
Getting the breakdown of each textile at every stage of production is hard and requires extensive research. Most research is focused on the CO2 emissions per kg fibre.
If we have learnt anything from the cotton case study, it’s that GHG emissions don’t end at the production of fibre, rather they can go on even after the garment has been disposed of.
Let’s look at Wool and Hemp, two alternatives that have lower emissions than cotton.
Wool’s GHG emissions in textiles
As per the data given above, the CO2 emissions of wool are lower. However, as per CO2 everything, 2 square meters of Wool fabric is equivalent to 13.89kg CO2e.
The difference could be because of the different methods used to study, the process after the production of fibre and more.
Let’s look at a study that was conducted in the Yass Region, New South Wales. The study found a total of 24.9 kg CO2-e per kg of greasy wool at the farm gate. The yield was 65.32 t per annum.
- Direct emission of methane on-farm was the dominant emission – 86% in total.
- Nitrous oxide emitted from animal wastes directly 5% and indirectly 5%.
- Only 2% of total emissions were embodied in farm inputs, including fertilizer.
- 1% emissions came from pasture residue
Hemp – the carbon-negative alternative
The fibre with the lowest CO2 emissions on the table was hemp. Let’s look into more detail.
This data shows that 1 acre of hemp absorbs 10 tons of CO2. This means that hemp is actually carbon negative. This means that hemp actually absorbs CO2 while it grows.
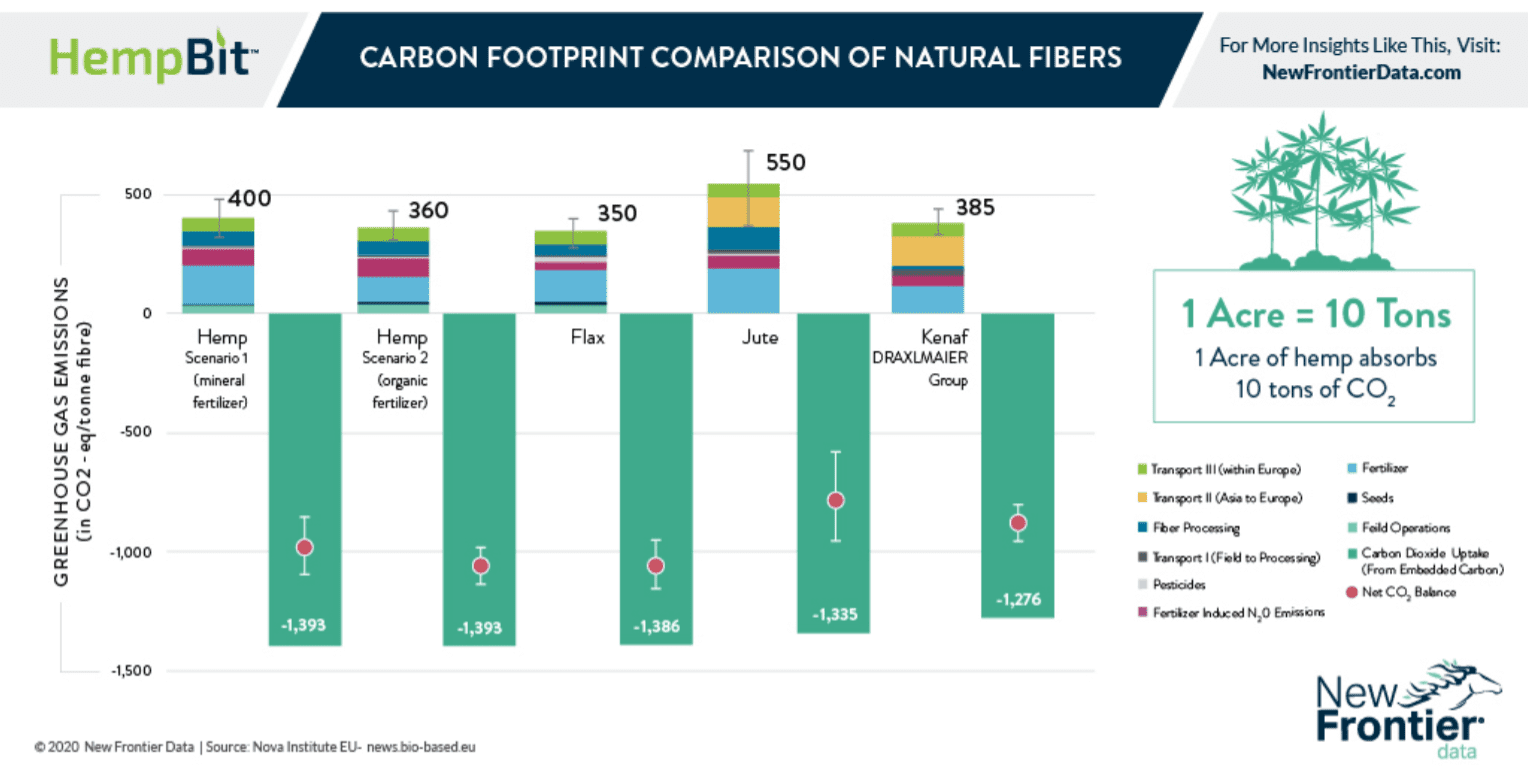
Just one hectare of hemp offsets a year’s carbon from two cars.
In fact, it has been scientifically proven that hemp absorbs more CO2 per hectare than any forest or commercial crop and is therefore the ideal carbon sink.
However, the good natural properties of hemp can be negated by the production methods. After hemp is grown, there is a long process that covers it into garments.
To make sure that you purchase hemp garments with low GHG emissions, you have to ensure that the garments are sustainably produced.
Natural farming is one such instance of preserving the goodness of hemp. Hemp foundation follows an ecological farming approach that emulates nature.
How does this reduce GHG emissions?
- A significant source of greenhouse gas emissions comes from the manufacture of synthetic nitrogen (N) fertilizers. Natural farming eliminated GHG by not using any chemical fertilizers or organic manures.
- The production of synthetic pesticides is energy intensive and can emit even more greenhouse gas per kg than the production of synthetic fertilizers. Natural famine does not use pesticides or herbicides.
Converting the hemp plant into fabric is a four-step process: cultivate hemp, break it down, extract the fibres, and spin the fibres to produce textiles.
Hemp foundation follows a labor-intensive process most of the work is done by hand and simple machinery. It does not require excessive energy or fuel that contributes to GHG emissions.
So, what are you waiting for? Purchase your hemp T-shirt today. And why stop there? With hemp, the possibilities are endless. You can even find hemp socks, jackets, beanies and underwear. This is an easy way to lower the GHG emissions of cotton and other textiles.
Each purchase you make, brings us closer to a greener tomorrow.
Sources: